
With all the movements happening right now and so much focus put on FANG type of stocks – I am looking for some possible entries in other sectors.
I have flown with Lufthansa too many times 🙂 That also helps me to know the quality of the business … but in the world of investing – no emotions …. lets look at what the chart and its Price Action tells us.
Lets start with Weekly ….
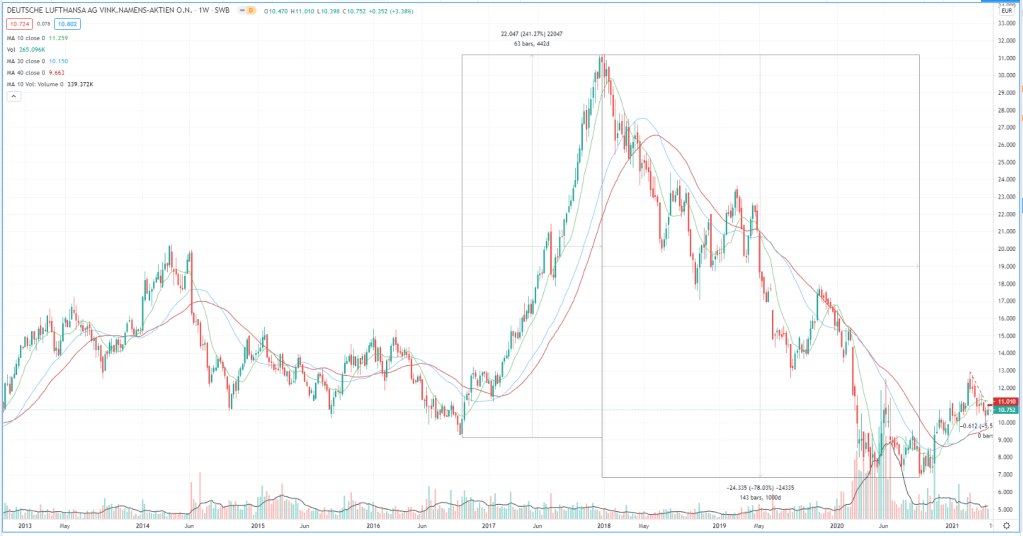
Following the 240% growth – the stock has experienced a close to 80% price correction. It happened over almost 3 years with bottom reinforced by Covid events. All that time 40SMA (equivalent to 200SMA on daily) has been trending down – basically removing any interest on my side.
Though since the move over 40SMA (around November 2020 time) – i am watching the stock. And things are turning around. Here is what I see:
[1] 40SMA is trending up now
[2] look at this huge volume in Q2 of 2020 – someone was buying in bulk 🙂
Lets look now closer at Daily chart:

[1] Longer SMAs (150 and 200) are growing and price is above them – good sign
[2] Price dived under 50 SMA – not so good sign
[3] We have seen a short term up trend (from 8 up to 13 price level) – what we see is a natural correction now
So what am I waiting for:
[1] Break the downward trend on daily
[2] start setting up new higher lows and higher highs
[3] signal level at 11.01.
We will see how it plays out ….. 🙂
